d3-nelson-rules
d3 utility to apply nelsons rules of process control to a set of data
JavaScript16mit
4 years ago
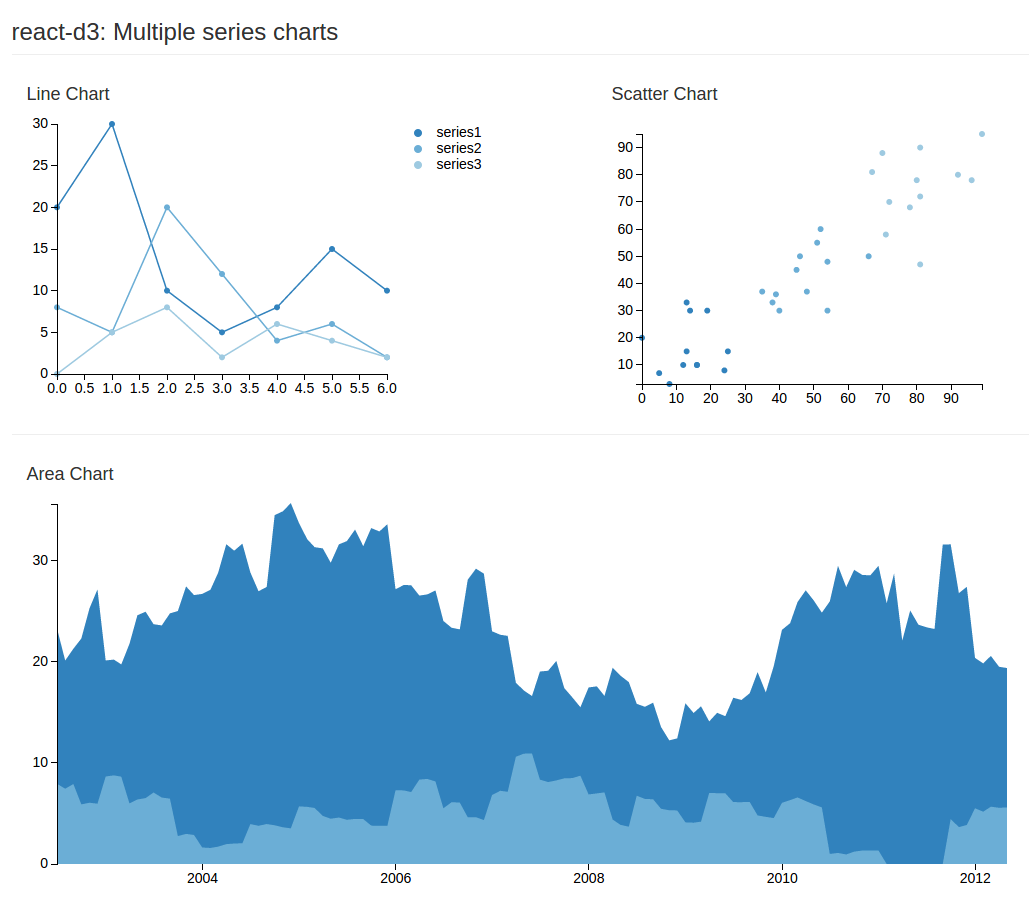
react-d3-components
D3 Components for React
JavaScript1626mit
3 years ago
area-chartchartchart-component
d3.compose
Compose complex, data-driven visualizations from reusable charts and components
JavaScript698mit
2 years ago
d3-component
A lightweight component abstraction for D3.js.
JavaScript108bsd-3-clause
7 years ago
componentdata-visualizationhtml5
d3-dsv
A parser and formatter for delimiter-separated values, such as CSV and TSV.
JavaScript431isc
11 months ago
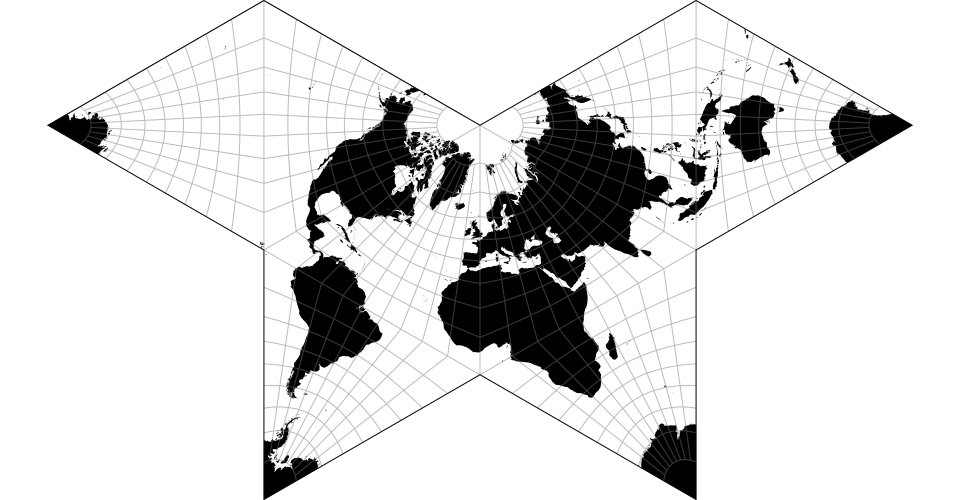
d3-geo-polygon
Clipping and geometric operations for spherical polygons.
JavaScript105other
4 months ago
d3-node
Server-side D3 for static chart/map generation ✨📊
JavaScript682
5 months ago
d3data-visualizationnode
d3-dag
Layout algorithms for visualizing directed acyclic graphs
TypeScript1433mit
5 months ago
d3graphtypescript
d3-template
D3 plugin to create and render templates using D3's data binding mechanism
JavaScript8bsd-3-clause
2 years ago
d3-jetpack
🚀 Nifty convenience wrappers that speed up your daily work with d3.js
JavaScript611bsd-3-clause
2 years ago
d3-funnel
A JavaScript library for rendering funnel charts using the D3.js framework.
JavaScript331mit
4 months ago
chartd3javascript
d3-bumps-chart
A d3 plugin for visualizing bumps charts
JavaScript14bsd-3-clause
11 months ago
bumpsd3svg
d3-voronoi-treemap
D3 plugin which computes a treemap based on a Voronoi tesselation
JavaScript201bsd-3-clause
2 years ago
angular2-d3-v4
Example of using Angular 2 with D3.js version 4
TypeScript66
7 years ago
angular2d3jsd3v4
simple-map-d3
A very simple "choropleth" style map with D3. All you need is a GeoJSON of poly
JavaScript115mit
8 years ago
d3-context-menu
A plugin for d3.js that allows you to easy use context-menus in your visualizati
CSS140mit
4 years ago
d3-hsluv
D3 implementation of human-friendly HSL
JavaScript10bsd-3-clause
6 years ago
colorcolor-paletted3
d3-composite-projections
Set of d3 projections for showing countries distant lands together
JavaScript99other
2 years ago
d3-flame-graph
A D3.js plugin that produces flame graphs from hierarchical data.
JavaScript874apache-2.0
6 months ago
d3-annotation
Use d3-annotation with built-in annotation types, or extend it to make custom an
JavaScript750apache-2.0
2 years ago
annotationsd3d3-annotation
d3-vector
A D3 force plug-in for programmatically determining a set of vectors' angles and
JavaScript4mit
5 years ago
d3-iconarray
A D3 module for making grids of icons
JavaScript85bsd-3-clause
3 years ago
d3data-visualisationgrid
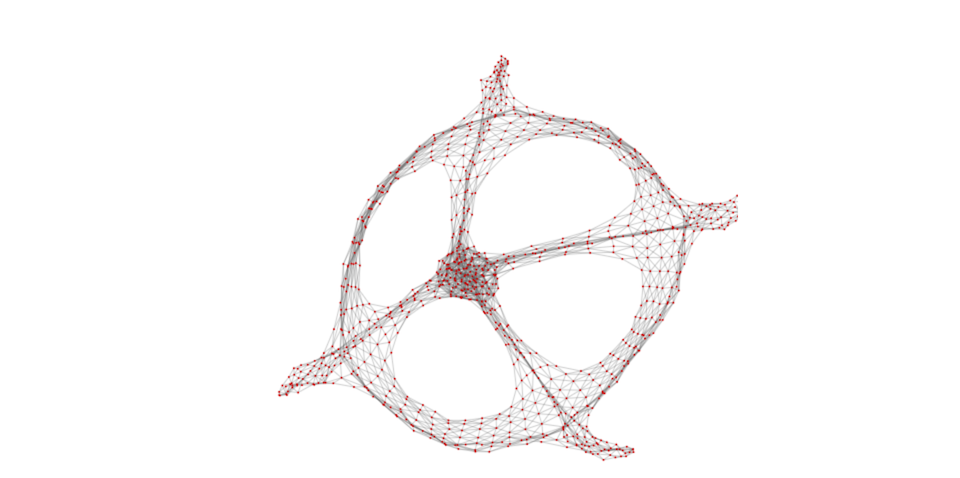
d3-force-sampled
A fast, simple, memory-efficient graph layout algorithm for visualizing networks
JavaScript50bsd-3-clause
3 years ago
d3jsgraphjavascript
rfc7946-to-d3
Converts rfc7946 geojson polygons to d3 compatible ones
JavaScript11
6 years ago
d3geojsonwinding
awesome-d3
A list of D3 libraries, plugins and utilities
5208other
2 years ago
chartsd3jsdatavisualization
d3-geomap
A library for creating geographical maps based on D3.js
JavaScript132mit
9 months ago
choroplethchoropleth-mapd3
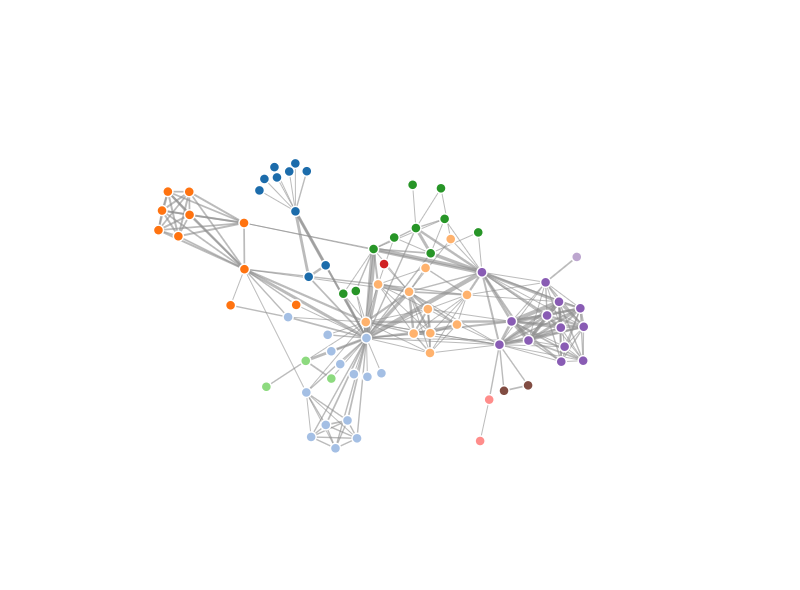
d3-force
Force-directed graph layout using velocity Verlet integration.
JavaScript1815isc
11 months ago
d3-MQTT-Topic-Tree
A MQTT Topic Tree viewer using the d3 collapsable tree and MQTT over websockets
JavaScript97
4 years ago
d3-force-gravity
Implement gravitational attraction (or force-field-like repulsion) using d3-forc
JavaScript22
8 years ago
d3-geo-scale-bar
Displays automatic scale bars for projected geospatial data.
JavaScript44bsd-3-clause
2 years ago
d3-interpolate-path
Interpolates path `d` attribute smoothly when A and B have different number of p
JavaScript315bsd-3-clause
2 years ago
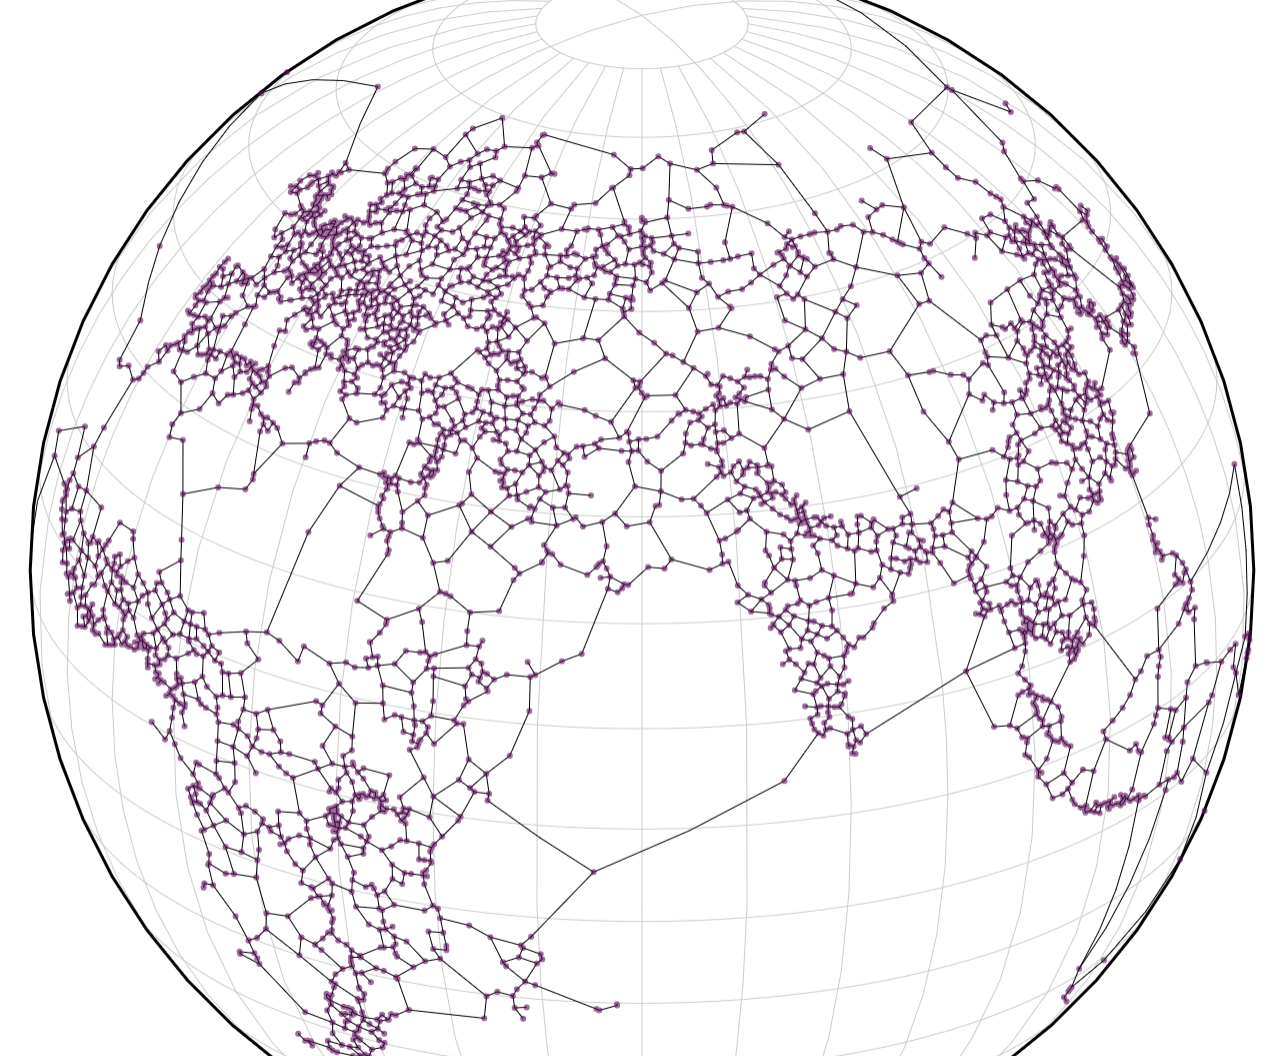
d3-geo-voronoi
Voronoi / Delaunay tessellations on the sphere
JavaScript228isc
5 months ago
convex-hulld3d3js
d3-sparql
Query a SPARQL endpoint with a SELECT query and get the data ready to be used wi
JavaScript116bsd-3-clause
6 years ago
d3jsjsonrdf
techan.js
A visual, technical analysis and charting (Candlestick, OHLC, indicators) librar
JavaScript2404mit
4 years ago
c3
:bar_chart: A D3-based reusable chart library
JavaScript9336mit
5 months ago
chartd3data-visualization
dTree
A library for visualizing data trees with multiple parents, such as family trees
JavaScript512mit
6 months ago
d3dtreefamily-tree
d3scription
D3.js tooltip plugin made simple. With single-page apps in mind.
TypeScript30mit
3 years ago
Vs
Vue Visualisation Package using d3.js and leaflet.
Vue167mit
4 years ago
d3v4data-visualizationvuejs2
semiotic
A data visualization framework combining React & D3
JavaScript2428other
7 months ago
d3d3-visualizationdata-visualization
plottable
:bar_chart: A library of modular chart components built on D3
TypeScript2959mit
last year
chartchart-componentcharting-library
topogram
Continuous area cartograms with d3 and TopoJSON
HTML327mit
2 years ago
cartogramjavascripttopojson
ipydagred3
ipywidgets library for drawing directed acyclic graphs in jupyterlab using dagre
Python79apache-2.0
5 days ago
d3dagredagre-d3
d3-force-reuse
Faster force-directed graph layouts by reusing force approximations
JavaScript124bsd-3-clause
3 years ago
d3jsgraphvisualization
d3plus
A javascript library that extends D3.js to enable fast and beautiful visualizati
JavaScript1623mit
9 months ago
blast-radius
Interactive visualizations of Terraform dependency graphs using d3.js
JavaScript2064mit
3 months ago
diagramgraphvizinteractive-visualizations
netvis
d3.js-based tool to visualize network communication for arbitrary protocols
JavaScript17mit
10 years ago
visavail
A D3.js Time Data Availability Visualization
JavaScript306mit
3 years ago
chartcontinuous-datad3
CodeFlower
Source code visualization utility written in JavaScript with d3.js. Does your co
JavaScript691mit
3 years ago
xkcdgraphs
Instant XKCD-style Graphs created in Javascript D3 for your enjoyment
JavaScript442
7 years ago
datamaps
Customizable SVG map visualizations for the web in a single Javascript file usin
JavaScript3774mit
2 years ago
EventDrops
A time based / event series interactive visualization using d3.js
JavaScript1241mit
2 years ago
d3dataviz
tauCharts
D3 based data-focused charting library. Designed with passion. Flexible.
JavaScript1915other
last year
d3fc
A collection of components that make it easy to build interactive charts with D3
HTML1279mit
4 months ago
chartd3d3fc
d3js-angular-examples
This project shows how to integrate D3.js with Angular 2.
TypeScript202mit
2 years ago
xlsx-populate
Excel XLSX parser/generator written in JavaScript with Node.js and browser suppo
JavaScript956mit
8 months ago
exceljavascriptxlsx
mpld3
An interactive data visualization tool which brings matplotlib graphics to the b
Jupyter Notebook2341bsd-3-clause
10 months ago
recharts
Redefined chart library built with React and D3
TypeScript23313mit
4 months ago
chartcharting-librarycomponents
britecharts
Composable Charting Library based on reusable D3.js components.
JavaScript3737apache-2.0
last year
britechartschartd3
chess-dataviz
chess visualization library written for d3.js
JavaScript71mit
4 years ago
chessjavascriptvisualization-library
billboard.js
📊 Re-usable, easy interface JavaScript chart library based on D3.js
TypeScript5788mit
4 months ago
chartd3data-visualizations
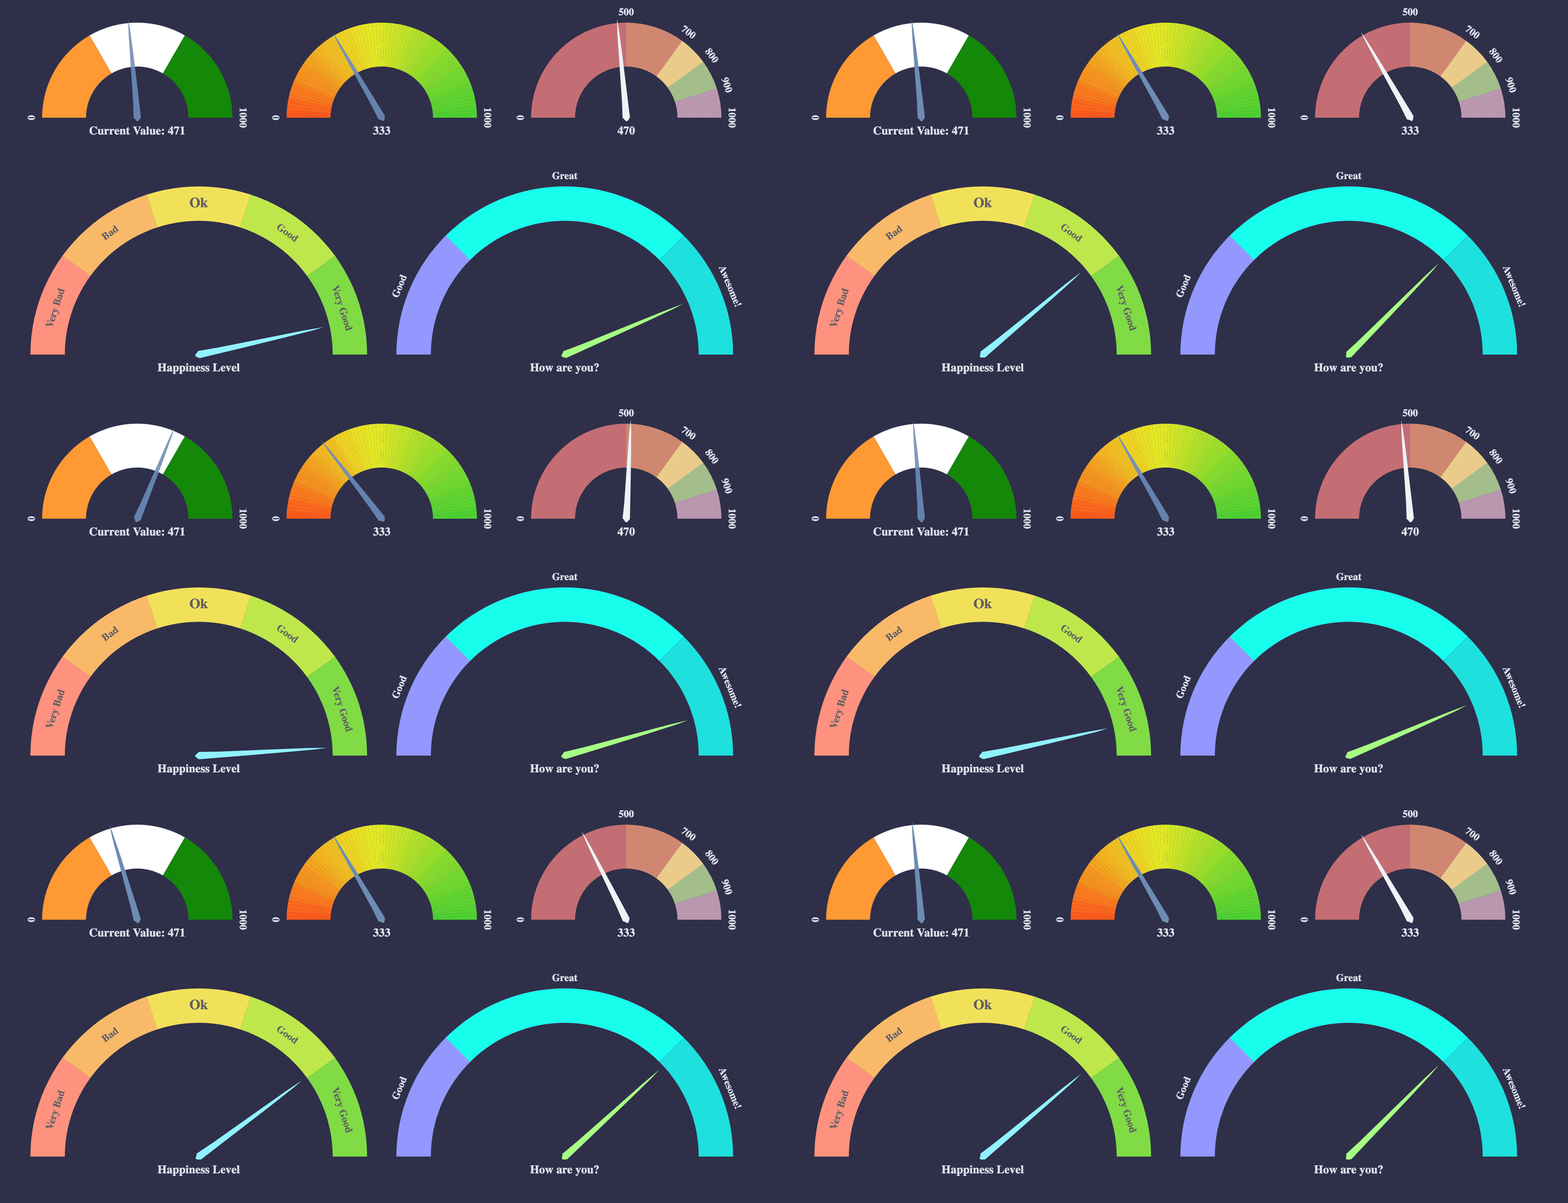
svelte-speedometer
Svelte component for showing speedometer like gauge using d3
JavaScript16
4 months ago
react-simple-maps
Beautiful React SVG maps with d3-geo and topojson using a declarative api.
JavaScript3044mit
12 months ago
d3v4mappingnodejs
space-radar
Disk And Memory Space Visualization App built with Electron & d3.js
JavaScript1384
6 months ago
docker-swarm-visualizer
A visualizer for Docker Swarm Mode using the Docker Remote API, Node.JS, and D3
JavaScript3283apache-2.0
29 days ago


