
krane
Kubernetes RBAC static analysis & visualisation tool
Ruby676apache-2.0
2 days ago
analysisk8skubernetes
nat
NeuroAnatomy Toolbox: An R package for the (3D) visualisation and analysis of bi
R64
last month
3dconnectomicscran
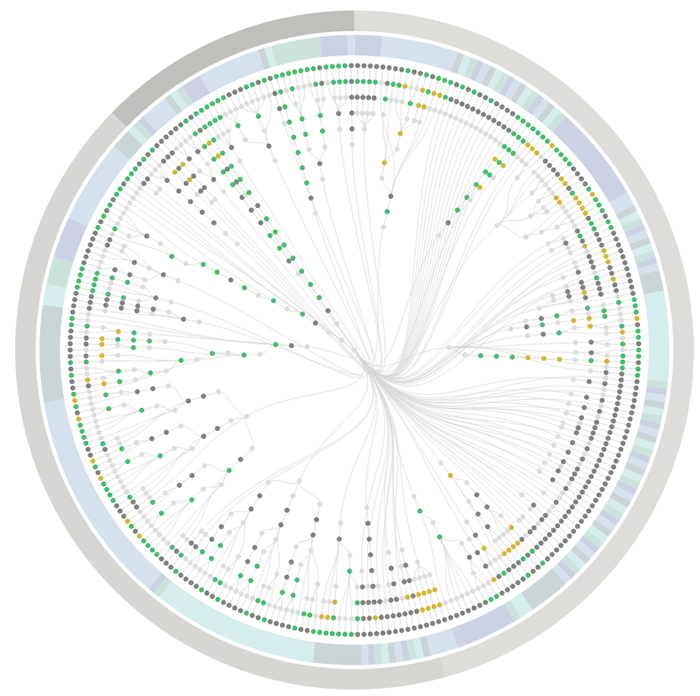
cytoscape.js
Graph theory (network) library for visualisation and analysis
JavaScript10129mit
20 hours ago
analysiscytoscapejsgraph-theory

chart-fx
A scientific charting library focused on performance optimised real-time data vi
Java506lgpl-3.0
2 months ago
chart-fxcharting-librariesdata-visualisation
jitwatch
Log analyser / visualiser for Java HotSpot JIT compiler. Inspect inlining decisi
Java3097other
last month
escape-analysishotspothotspot-jit-compiler


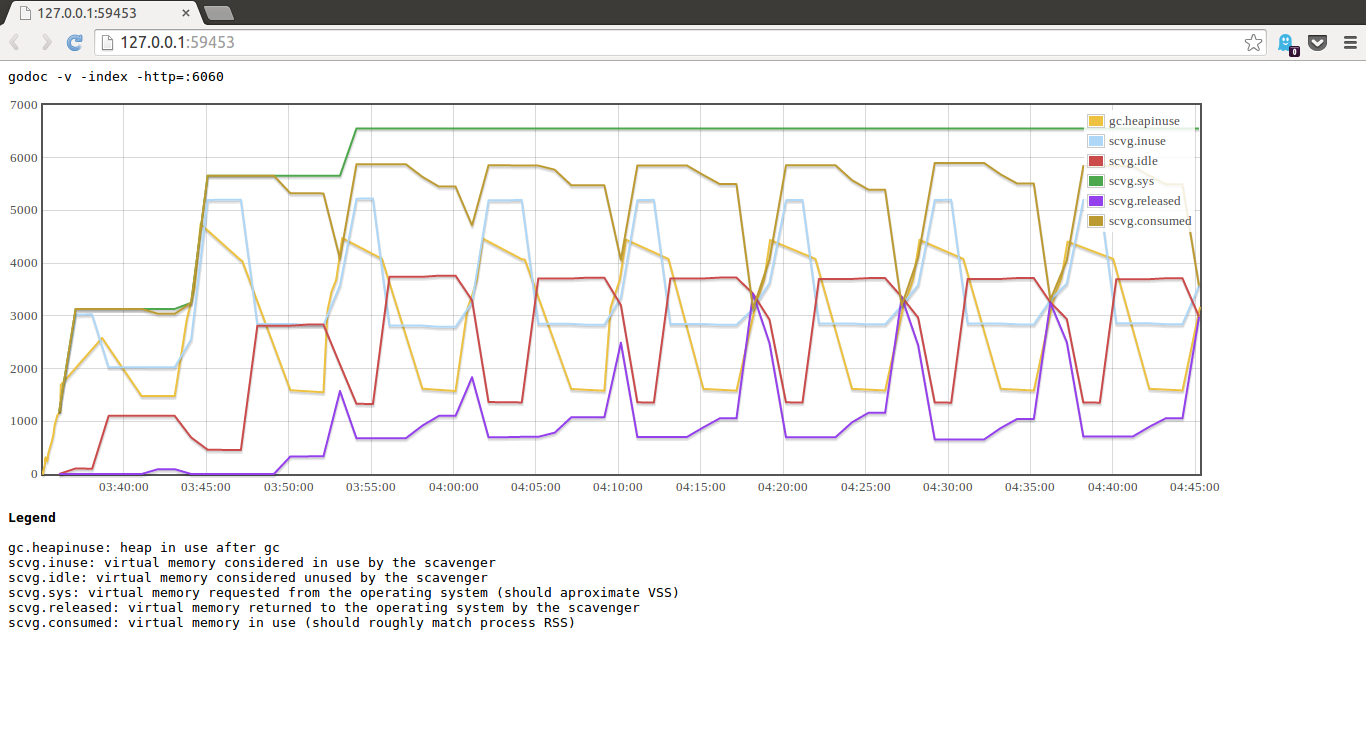
statsviz
🚀 Visualise your Go program runtime metrics in real time in the browser
Go3171mit
7 months ago
garbage-collectorgogolang
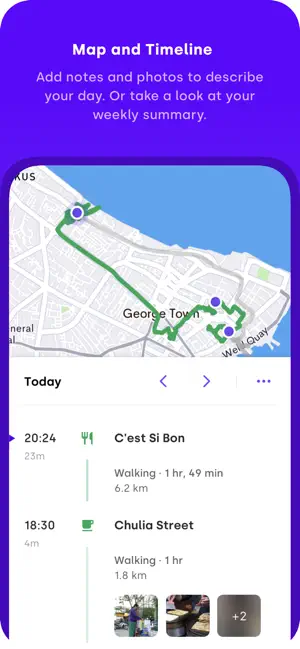
awesome-quantified-self
Description Automatically keep track of the places you visit, how you got the
2348other
3 months ago
awesomeawesome-listlist
openremote
100% open-source IoT Platform - Integrate your devices, create rules, and analys
Java1256other
3 hours ago
asset-managementbuildingdashboard
nix-du
Visualise which gc-roots to delete to free some space in your nix store
Rust318lgpl-3.0
10 months ago
nixnixosnixpkgs

doctrine
A very simple tool for visualising how competitive is the company in the light o
JavaScript52apache-2.0
4 months ago
doctrinesimon-wardley-doctrinewardley

matomo
Empowering People Ethically with the leading open source alternative to Google A
PHP19445gpl-3.0
3 months ago
analyticsgrowthhacktoberfest

Awesome-JSON-Viewer
:fire: A Chrome extension to visualise JSON response and introduce awesome JSON
JavaScript548
8 months ago
chrome-extensionjsonjson-viewer
twitter-sentiment-visualisation
🌍 Sentiment analysis over real-time social media data, rendering live charts to
CoffeeScript209
last year
data-visualisationsentiment-analysissentiment-visualisation


Vs
Vue Visualisation Package using d3.js and leaflet.
Vue167mit
4 years ago
d3v4data-visualizationvuejs2

parcel-plugin-bundle-visualiser
A plugin for the parcel bundler to visualise bundle contents
JavaScript274mit
2 years ago
PhantomFlow
Describe and visualise user flows through tests with PhantomJS
JavaScript682mit
7 years ago

ScrollableGraphView
An adaptive scrollable graph view for iOS to visualise simple discrete datasets.
Swift5317mit
4 years ago
uk-car-accidents
A Plotly Dash App for visualising car accidents in the UK in 2015
Jupyter Notebook9
6 years ago

iTunes-Graphs
A macOS app to visualise your iTunes library as graphs.
Swift52
7 years ago
cocoaitunes-apimacos

ImmersivePoints
Visualise your data in virtual reality with ImmersivePoints
HTML14
3 years ago
hacktoberfestlidaroculus-quest